Setting benchmarks for indicators is a necessary but often challenging step in defining monitoring objectives. Benchmarks should be based on knowledge of the potential of the land and conditions needed to sustain desired ecosystem structure, function, and ecosystem services. For example, the BLM has set a number of benchmarks for sagebrush cover and other vegetation characteristics in order to maintain habitat for the Greater sage-grouse as part of the Resource Management Plan amendment process (e.g., Stiver et al. 2015). These benchmarks were based on research studies of what conditions are beneficial for sage-grouse. Another common approach is to use the conditions observed at individual or groups of reference sites to set benchmarks. For example, the EPA has partnered with BLM and other agencies to identify a network of “least disturbed” sites. Benchmarks are then defined in terms of departure of sampled sites from the range of indicator values across a network of “reference” sites. Networks of reference sites can be used to account for natural variability among sites and through time (reviewed in Hawkins et al. 2010).
Benchmarks will often vary across the landscape based on natural environmental gradients and it is important to take these variations into account when setting benchmarks. The goal is to ensure we are comparing assessed sites to those with similar potential. Thus, similar biophysical areas with similar ecological potential should have similar benchmarks. In contrast, areas with large differences in ecological potential may have large differences in benchmarks. There are numerous approaches for accomplishing this that range from landscape classification systems to modeling continuous ecological gradients. Ecological site descriptions (Caudle et al. 2013), grouping least disturbed sites by ecoregion or stream size (Hughes et al. 1986; Hawkins et al. 2000), or grouping sites by Rosgen stream type are examples of landscape classification. Site-specific empirical models (e.g., Hill et al. 2013; Olson and Hawkins, 2012) avoid the need for categorizing of landscapes into discrete categories by modeling continuous environmental gradients, with each assessed site capable of having different potential.
Benchmarks may also vary based on management objectives. For example, a post-treatment objective for an Emergency Stabilization treatment may differ from an objective for a land health standard that is evaluated on an ecological site within a grazing allotment. Within BLM, there may be specific policy guidance that informs objectives (see discussion below). Rather than varying benchmarks based on management objectives, another approach is to vary the proportion of the landscape required to meet the benchmark. This approach enables land managers to strive for a consistent set of conditions, but make management decisions about the percentage of resources that meet those conditions based on their management objectives. For example, a larger proportion of the landscape may be required to meet benchmarks in a Wilderness Study Area compared to a motorized recreation area.
Approaches for setting benchmarks
The key to setting benchmarks is to clearly document and justify the approach you take. Below, we provide an overview of common approaches to setting benchmarks (Figure 1). These approaches vary in their potential for bias, our ability to quantify bias, ease of communication, applicability to the management question, and availability in your geographic region. However, all can be defensible if used appropriately and your reasoning is well-documented. Often, a combination of these approaches is required to cover different monitoring indicators or to provide multiple lines of evidence and increase confidence in the benchmark. Best professional judgment including review by an interdisciplinary team should inform any benchmark setting approach.
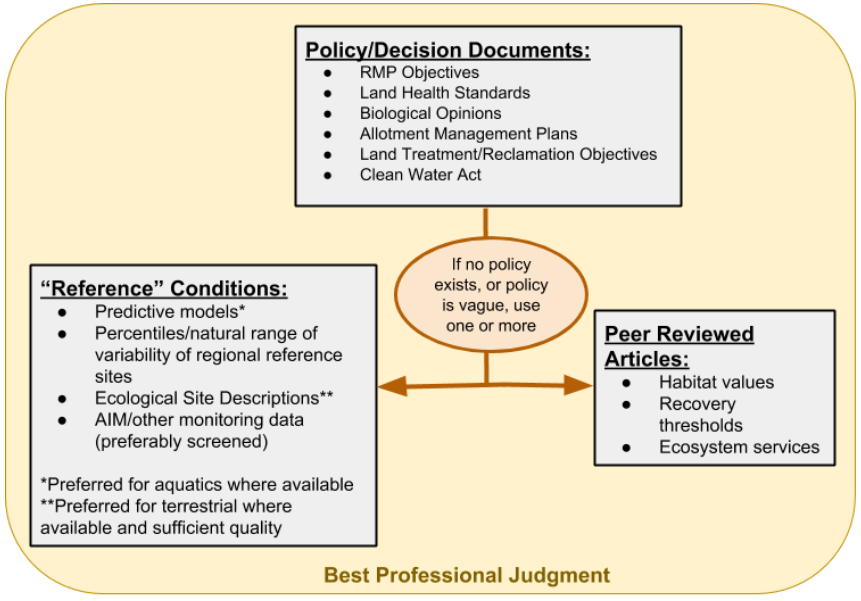
Figure 1. Overview of approaches and example sources for setting benchmarks.
Policy.
Specific benchmark values are sometimes set in policy and/or decision documents (e.g., Biological Opinions, Resource Management Plan amendments for Greater sage-grouse). Generally, these benchmark values are based on one or more of the other information sources. Rather than specific benchmark values, policy documents may instead outline an approach to use to set benchmarks (e.g., reference conditions in the Land Health Manual and Handbook, site stabilization criteria for Emergency Stabilization and Rehabilitation treatments). All policy recommendations should be followed as these represent legal commitments by BLM. More examples include State Air or Water Quality Standards, Resource Management Plan objectives, or Allotment Management Plan objectives.
Best practices for the implementation of policy benchmarks:
- Ensure policy is current
- Ensure policy is applicable to your geographic area of interest
- Review whether new science has emerged since policy established that could help inform or refine benchmarks
Reference Conditions.
Reference conditions are thought to provide important context in land management because they represent a state where ecological processes and functions are maintained (e.g., IIRH Tech Ref, BLM Land Health Handbook). Thus, reference conditions can be used to characterize expected natural conditions for assessed sites, from which we can set benchmarks for land management (reviewed in Stoddard et al. 2006). The “reference” condition can be defined in a variety of ways, from historic conditions (e.g., pre-European settlement in North America) to least-disturbed conditions representing the best available conditions found through the present day landscape under natural disturbance regimes. Recognizing the difficulty of characterizing historic conditions, a practical approach to determining reference conditions is to identify least disturbed conditions (i.e. minimal human impacts). Such conditions can be identified by screening landscapes for areas where 1) ecological processes are functioning (as inferred from structural/functional indicators; Pellant et al. 2005, forthcoming; BLM Land Health Handbook) and/or 2) surface disturbances are below thresholds thought to impact ecosystem structure and function (e.g., < 1 km/km2 road density, < 3% agricultural land use, certain distances away from water sources where livestock grazing pressure is light to moderate; e.g., Landsberg et al. 2003; Miller et al. 2016; Ode et al. 2016). The characterization of least disturbed conditions can vary through space and time as human impacts are disproportionately distributed, changing through time, and capable of having differing impacts under certain physiographic conditions. Similarly, the criteria used to identify least disturbed conditions can vary among indicators.
Below we highlight several different ways benchmarks can be developed from a group of reference sites. We largely focus on the use of multiple reference sites from which the range of conditions likely to occur is characterized. This “natural range of variability” of reference conditions acknowledges the dynamic nature of ecosystems resulting from natural disturbance events such as drought, floods, disease, fire, mass wasting events, and grazing by native ungulates.
Predicted natural conditions (available for several lotic indicators; applies to terrestrial also but often not available): Field data from a network of reference sites can be combined with geospatial data to model reference conditions across the landscape. These models can then be used to predict reference conditions for sampled sites. In this approach, benchmarks are set based on the site specific predictions and associated error of the model. Models can be advantageous because they account for gradients in resource potential, make site specific predictions, and have known levels of error in their predictions. Models have been developed that predict reference conditions for lotic macroinvertebrates, nutrients, stream temperature, and some instream habitat variables for selected geographic regions (e.g., Hill et al. 2013, Olson and Hawkins 2012); similar models for terrestrial ecosystems are in development.
Best practices for the implementation of benchmarks based on predictive models:
- Review a list of models available from NOC and consult with others in your state to determine if any others exist that you should be aware of. Then schedule a call with the NOC to discuss pros and cons of each available model.
- When choosing models consider the following:
- Ensure the compatibility among field methods used in the sampling of reference site networks with your own monitoring data
- Understand how reference conditions were defined and used to develop a given model
- Ensure that reference data used to create a specific model are applicable to the geographic area of interest
- Consider the quality of the model benchmarks; how well can the model predict reference conditions and how large is the model error used to set the benchmarks?
- When reviewing resulting benchmarks from a model:
- Consider if the model was applicable to a given site (NAMC provides output to assist with this for lotic models)
- Think critically about the degree of departure from reference that is allowable while still maintaining ecosystem structure and function
- Benchmarks derived from well performing models may be more protective of a resource than those derived from other benchmark setting approaches so decide if this is desirable for a given management question.
Percentiles/range of variability among reference site networks (broadly available for lotic ecosystems; applies to terrestrial also but often not available): Data collected at networks of reference sites can be used to develop frequency distributions of reference site indicator values. The distributions of indicator values are a characterization of the natural range of variability expected to occur in a region. The percentiles of the resulting distributions can be used to set benchmarks, against which your monitoring data can be compared and deviations from reference conditions identified. The main difference in this approach and a modeled approach is that rather than modeling reference conditions continuously across the landscape, reference site networks are typically grouped by categorical variables such as physiographic boundaries (e.g., level III ecoregions; Rosgen stream types; ecological sites) to account for differences in reference site potential and subsequent frequency distributions resulting from factors such as climate and topography. For example, the 90th and 70th percentiles of reference site fine sediment values for streams in the Colorado Plateau ecoregion can be used as benchmarks to classify the condition of a monitoring site as having “major”, “moderate”, or “minimal” departure from reference conditions, respectively. In other words, a site would be categorized as having major departure from reference conditions if the fine sediment value for a sample site is greater than that observed among 90% of reference sites in the Colorado Plateau ecoregion. In contrast, the site would be categorized as moderate departure if the site is less than 90% of reference sites but greater than 70% and minimal departure if less than 70% of reference sites. This approach does not have known levels of accuracy and precision, which lessens our understanding of if we may be over or under protecting a resource compared to a model approach.
Best practices for the implementation of benchmarks based on percentiles/range of variability among reference site networks:
- Ensure the compatibility among field methods used in the sampling of reference site networks with your own monitoring data
- Understand how reference conditions were defined and used to develop indicator distributions
- Samples sizes greater than 30 are optimal for developing representative distributions
- Separating reference sites into ecologically similar groups can help account for natural variability but should be balanced with meeting minimal sample sizes
- Ensure that reference data used to build distributions are applicable to the geographic area of interest
- Consider indicator distributions: Highly skewed or narrow reference distributions (e.g., very small interquartile range or difference in indicator values between the 25th and 75th percentiles), or distributions with upper or lower limits, may need to be handled differently
- Think critically about the degree of departure from reference that is allowable while still maintaining ecosystem structure and function
Ecological Site Descriptions (ESD’s) or other land potential-based classifications (e.g. habitat types): Ecological Site Descriptions (ESD’s) provide information about different types of land, including their potential or reference condition, that can be used to set benchmarks. The interagency manual defines an ecological site as “a conceptual division of the landscape that is defined as a distinctive kind of land based on recurring soil, landform, geological, and climate characteristics that differs from other kinds of land in its ability to produce distinctive kinds and amounts of vegetation and in its ability to respond similarly to management actions and natural disturbances” (Caudle et al. 2013). An underpinning assumption is that soils, climate, geomorphology, and plant species can be grouped with sufficient precision to inform reference conditions and associated changes. ESD’s are conceptually similar to the previous approaches but differ in that the development process relies more on professional judgment. They are developed by the USDA-NRCS and other partners using a variety of information sources, including professional judgment, peer-reviewed studies and field data.
Best practices for the implementation of benchmarks based on Ecological Site Descriptions:
- Given high variation in quality, be sure to consider the ESD itself as well as the information that it is based on.
- Based on the ESD’s state-and-transition model of ecosystem dynamics, the reference state (or the appropriate community within it given recent disturbance) is generally used to set benchmarks, given that this state generally provides the most future options for management.
- When available, reference sheets from Interpreting Indicators of Rangeland Health (Pellant et al. 2005, forthcoming) are ideal sources of benchmarks.
- Ensure compatibility among field methods used in ESD and reference sheet documentation with your own monitoring data, and be ready to adjust benchmarks accordingly to address incompatibility. Contact the NOC for past research on how different methodologies compare.
- More information about the conceptual underpinnings of ESD’s and their treatment of reference conditions is available from Caudle et al. (2013) and Pellant et al. 2005, forthcoming).
Current conditions from other monitoring data: Existing monitoring data, whether or not it’s from reference sites, can provide an additional line of evidence for setting benchmarks. This type of information is especially useful when other benchmark information is lacking. While previously described approaches largely represent off the shelf products developed by others, this approach is guided by the end user and requires considerable discretion. There are two broad steps to this approach. First, select a set of sites to use as your “reference.” This will include screening sites by specific attributes (e.g., burned vs. unburned; percent disturbance in the watershed) to identify best available/least disturbed conditions and ensure there is sound reasoning to expect that they are in good condition and represent a management target. When screening potential sites, it is advisable to use a different or at least a much broader set of sites than the ones in your area of interest for which you seek to assess condition and trend (see best practices). Second, decide what fraction of sites is likely in “reference” or desired condition, taking into account the monitoring design used to select the sites and any site screening. Your benchmark will correspond to the value those sites have. A visualization of the data using histograms or box plots (e.g., Fig. 2) will be essential. For example, the EPA recommends using 5th or 25th percentile of regional nutrient concentrations in streams as a benchmark to differentiate acceptable vs. unacceptable nutrient values if working with a network of non-reference sites (US EPA 2000). Keep in mind that which quantile you use will depend on whether the indicator increases or decreases with degradation (e.g., in sagebrush steppe, degradation is associated with decreases in perennial grasses and increases in bare ground). Some indicators can be both too high and too low (e.g., litter). This approach can be very informative, especially in combination with other sources of information. See example from northeastern California (Figure 2).
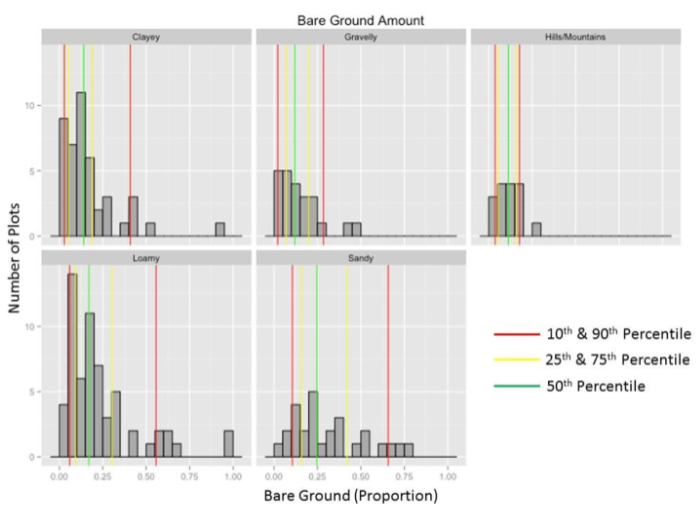
Figure 2. Example histograms of bare ground for all unburned terrestrial AIM plots in an ecoregion, split by type of land. This information can be helpful for setting benchmarks. For example, if you decided that the lower 25% percentile of bare ground values represent desired conditions, the benchmark for clayey areas would be about 5% bare ground. The benchmark for sandy areas would be about 15% bare ground. Other information sources like professional judgment or peer reviewed articles should be used to validate and/or justify adjustments to these benchmarks.
Best practices for the implementation of benchmarks based on your own monitoring data or data collected by other entities:
- Consider whether to err on the side of “over-protecting” resources (e.g., benchmarks that result in more conservative management) vs. “under-protection” (less conservative).
- Ensure that reference data used to build distributions are applicable to the geographic area of interest.
- Start with a set of sites that is different or at least much broader than the area where you seek to assess condition and trend, to avoid circular reasoning. If instead you use the same sites to establish a benchmark at the 25th percentile, you will find that 25% of those sites will fail to meet the benchmark and 75% of them will meet it, which is an arbitrary finding.
- Carefully choose the screening criteria used to identify best available or least disturbed conditions. If screening results in the inclusion of degraded sites, the resulting benchmarks will under-protect the resource. Choose a percentile that is informed by your screening approach.
- In areas where site types such as ESD’s aren’t available, other potential-based resource classifications can be used to group monitoring sites, including classifications based on your AIM site characterization data.
- Samples sizes greater than 30 are ideal for developing representative distributions
- Consider indicator distributions: Highly skewed or narrow reference distributions (e.g., very small interquartile range or difference in indicator values between the 25th and 75th percentiles), or distributions with upper or lower limits, may need to be handled differently
- Think critically about the degree of departure from reference that is allowable while still maintaining ecosystem structure and function
Peer Reviewed Articles.
Scientific research that addresses how ecosystem structure, function, and services (including habitat) relate to indicator values can be very useful for setting benchmarks. Examples include the seasonal habitat indicator values in the Greater Sage-Grouse Habitat Assessment Framework (e.g., Table 16 on p. 41). Habitat conditions for other species detailed in Biological Opinions provide further examples. Good sources for peer reviewed studies include Google Scholar, JournalMap, and the BLM Library.
Best practices for the implementation of benchmarks based on peer-reviewed articles:
- Realize that the quality of all journals and published papers is not equal
- Ensure literature is current and from a reputable peer-reviewed journal
- Look for replication or corroboration of findings among multiple studies
- Cite the utilized studies, as well as providing a rationale for why other pertinent studies were not included
Best Professional Judgment.
Natural resource managers’ knowledge based on their experiences is one of the most widely available types of information for setting benchmarks. This information is very valuable, especially when it comes from multiple land managers with many years of experience with a variety of situations across the landscape (Knapp et al. 2011). Best professional judgement should be used to validate the results of any benchmark approaches. In addition, it should always be used as one of several lines of evidence.
Best practices for the implementation of benchmarks based on best professional judgement:
- Work in interdisciplinary teams
- Be aware of individual or group bias
- When possible, use best professional judgment along with other information types to set benchmarks
- Document your process
- Be prepared to provide resumes, should this approach be challenged in court
For more information, see BLM Rangelandand Health Handbook 4180-1; Interpreting Indicators of Rangeland Health; Chapter 4: Management Objectives in Measuring and Monitoring Plant Populations (Elzinga et al. 2003); Stoddard et al. 2006; Hawkins et al. 2010; and Karl and Herrick 2010; and other citations below.
References
Read more…
Caudle, D., J. DiBenedetto, M. “Sherm” Karl, H. Sanchez, and C. Talbot. 2013. Interagency ecological site handbook for rangelands. U.S. Department of the Interior, Bureau of Land Management; U.S. Department of Agriculture, Natural Resources Conservation Service; U.S. Department of Agriculture, Forest Service. U.S. Department of the Interior, Bureau of Land Management Handbook H-1734-1.
Elzinga, C. D.W. Salzer and J.W. Willoughby. Measuring and Monitoring Plant Populations. BLM Technical Reference 1730-1. Denver, CO.
Hawkins, C.P., J.R. Olson, and R.A. Hill. 2010. The reference condition: predicting benchmarks for ecological and water-quality assessments. Journal of the North American Benthological Society. 29:1, p. 312-343.
Hill, R.A., C.P. Hawkins, and D.M. Carlisle. 2013. Predicting thermal reference conditions for USA streams and rivers. Freshwater Science 32: 39–55.
Miller, S., P. Eldred, A. Muldoon, K. Anlauf-Dunn, C. Stein, S. Hubler, L. Merrick, N. Haxton, C. Larson, A. Rehn, P. Ode, and J. Vander Laa. 2016. A Large-Scale, Multiagency Approach to Defining a Reference Site Network for Pacific Northwest Streams. Environmental Management. 58:6, p. 1091-1104.
Karl, Jason W., and Jeffrey E. Herrick. 2010. Monitoring and Assessment Based on Ecological Sites. Rangelands 32, p. 60–64.
Knapp, C.N., M. Fernandez-Gimenez, E. Kachergis, A. Rudeen. 2011. Using participatory workshops to integrate state-and-transition models created with local knowledge and ecological data. Rangeland Ecology & Management 64:2, p. 158-170.
Landsberg, J, C.D. James, S.R. Morton, W.J. Muller, and J. Stol. 2003. Abundance and composition of plant species along grazing gradients in Australian rangelands. Journal of Applied Ecology. 40:6, p. 1008-1024.
Ode, P.R., A.C. Rehn, R.D. Mazor, K.C. Schiff, E.D. Stein, J.T. May, L. R. Brown, D.B. Herbst, D. Gillett, K. Lunde, and C.P. Hawkins. 2016. Evaluating the adequacy of a reference site pool for ecological assessments in environmentally complex regions. Freshwater Science. 35:1, 237-248.
Olson, J.R., and C.P. Hawkins. 2012. Predicting natural base-flow stream water chemistry in the western United States. Water Resources Research 48 (2): W02504.
Pellant, M., P. Shaver, D.A. Pyke, and J.E. Herrick. 2005, forthcoming. Interpreting Indicators of Rangeland Health. Technical Reference 1734-6. U.S. Department of the Interior, Bureau of Land Management, National Science and Technology Center, Denver, CO.
Stoddard, J.L., P. Larsen, C.P. Hawkins, R.K. Johnson, and R.H. Norris. 2006. Setting expectations for the ecological conditions of running waters: the concept of reference conditions. Ecological Applications 16:1267-1276.
USDI BLM. 2001. Rangeland Health Standards. US Department of Interior, Bureau of Land Management Handbook 4180-1.
USEPA [U.S. Environmental Protection Agency]. 2000. Nutrient criteria technical guidance manual: rivers and streams. EPA-822-B-00–002. U.S. EPA Office of Water, Washington, D.C., USA.
Wedel, W.R. 1963. The High Plains and their utilization by the Indian. American Antiquity 29, p.1-16.